Characterization of Genesis Samples
Genesis Collection Types: Wafer, Concentrator Targets, Other Surfaces
The Genesis mission collected solar wind atoms for 28 months. The collectors mounted on the return capsule consisted of five arrays, the concentrator target, gold foil, polished aluminum, metallic glass, and molybdenum-coated foils. The sample collectors are made up of fifteen materials that were chosen for bulk purity, surface cleanliness, and ability to retain the captured solar wind under space conditions. The materials chosen are listed on Table 1. An excellent description of the materials and their intended use as collectors is given in [1].
Concentrator Target Samples
The concentrator targets, their condition after return and solar wind fluence, measured and modeling, is described by [2]. The target holder, focal point of the concentrator, contained four quadrants: two SiC targets, a CVD target, and a DOS target. All targets survived intact except for the DOS target (Figs. 1 & 2).

Fig 1: Targets in mount after the sample return to earth.

Fig 2: Post-landing images of target quadrants (3-cm radius), left to right: DOS recovered 16 pieces, SiC analyzed and returned, SiC, CVD.
Determining Wafer Collector Fragment Material
Basic characterization of the Genesis samples consists of the following:
- Determining material of collector fragment (Table 1)
- Taking an overview image to assess sample size and surface condition
- Measuring collector thickness on wafer samples to determine solar wind collection regime
Collector fragments can be easily identified by optical observation, except for silicon. Czochralski grown silicon is distinguished from float zone silicon by using Fourier Transform Infrared spectroscopy (FTIR) to observe a carbon-oxygen bond.

Genesis sample fragments after full characterization.
Measuring collector thickness
Different thicknesses of the collection wafers were used for the Genesis mission that were specific to each of the solar wind regimes that were sampled (bulk composition, coronal mass ejection, high speed, low speed). See Table 2. We accurately measure the thickness of collector fragments to classify each fragment by solar wind regime, taking advantage of the differences in collection wafer thickness.
| Regime | Wafer Thickness (in µm) |
|---|---|
| Bulk Composition (B/C array) | 700 |
| Coronal Mass Ejection (E array) | 650 |
| High Speed (H array) | 600 |
| Low Speed (L array) | 550 |
A Mitutoyo Litematic VL-50® digimatic indicator is used to measure the thickness at the edge of each wafer away from any potential science testing areas. A second wafer thickness can be taken in the center of the sample using a Leica DM6000 microscope to an accuracy of ± 1.0 microns.
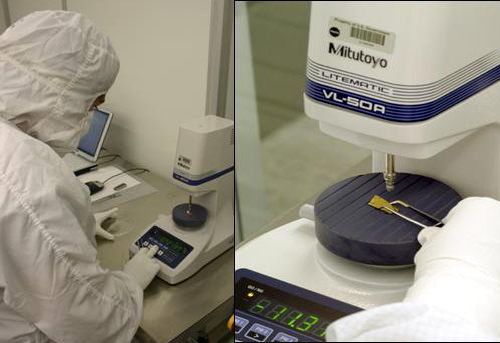
Genesis lab processor measures the thickness of a sample wafer to determine in which regime the solar wind was collected
Measuring sample dimensions with overview photo
Preparing to take high magnification image of a fragment

The Leica MZ9.5 stereoscope and the Leica DM6000 microscope are used to take detailed images of each sample. Canvas 12 software is used to measure and calculate the sample length, width and area based on the scaled images.